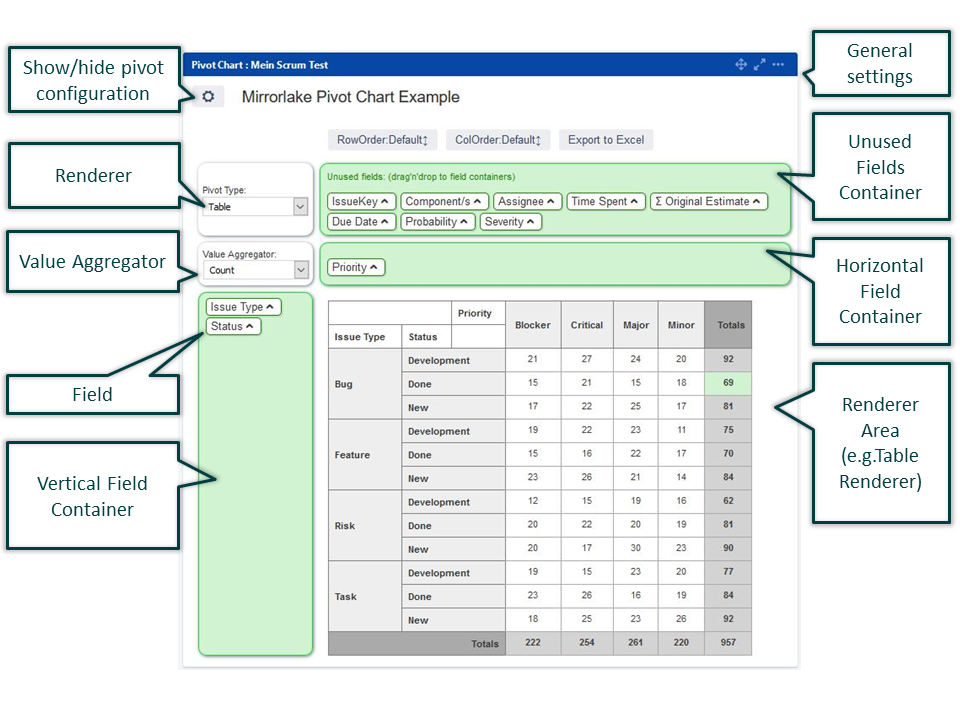
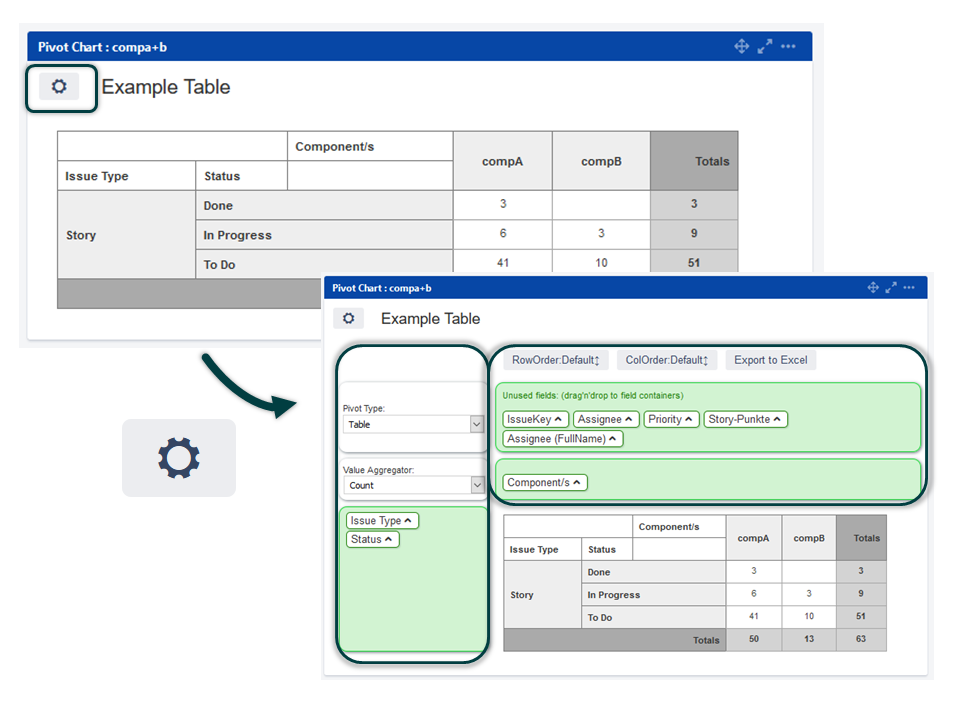
A pivot table or chart can be adjusted using the pivot configuration which can be shown and hidden by clicking the configuration button (gear symbol) next to the chart title.
A renderer visualizes the data of your pivot table. The following renderers are available:
Table
Table Barchart
Row Heatmap
Col Heatmap
Horizonatal Bar Chart
Horizontal Stacked Bar Chart
Bar Chart
Stacked Bar Chart
Line Chart
Area Chart
Scatter Chart
Multiple Pie Chart
Bubble Chart
The aggregator is used to determine the calculation method used for the table cells.
Count
Count Unique Values
List Unique Values
List All Values
Sum
Integer Sum
Average
Median
Trimmed Mean 10% (calculates the average without max and min values - 10% max/min values are ignored)
Trimmed Mean 20% (calculates the average without max and min values - 20% max/min values are ignored)
Trimmed Mean 30% (calculates the average without max and min values - 30% max/min values are ignored)
Sample Variance
Sample Standard Deviation
Minimum
Maximum
First
Last
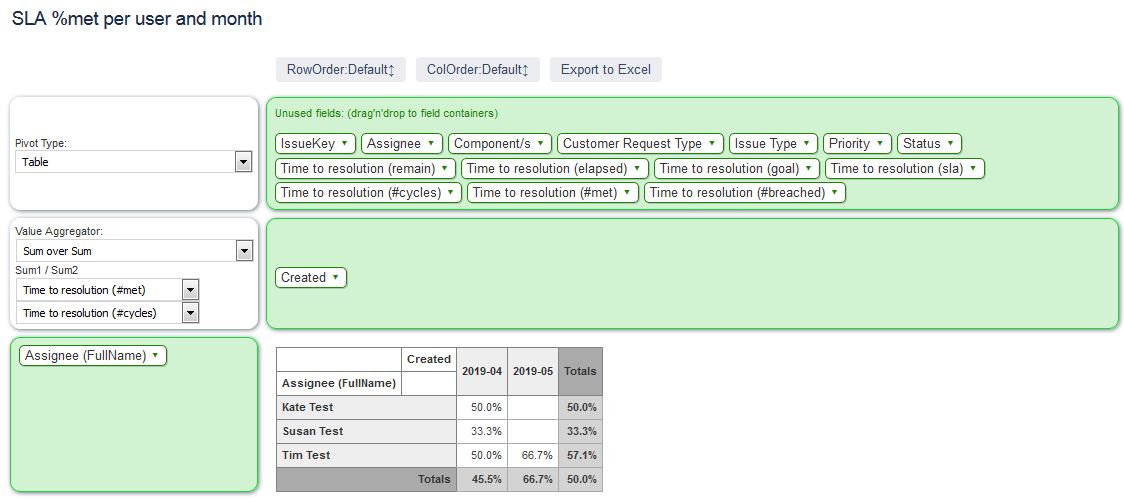
Sum over Sum
80% Upper Bound
80% Lower Bound
Sum as Fraction of Totals
Sum as Fraction of Rows
Sum as Fraction of Columns
Count as Fraction of Totals
Count as Fraction of Rows
Count as Fraction of Columns
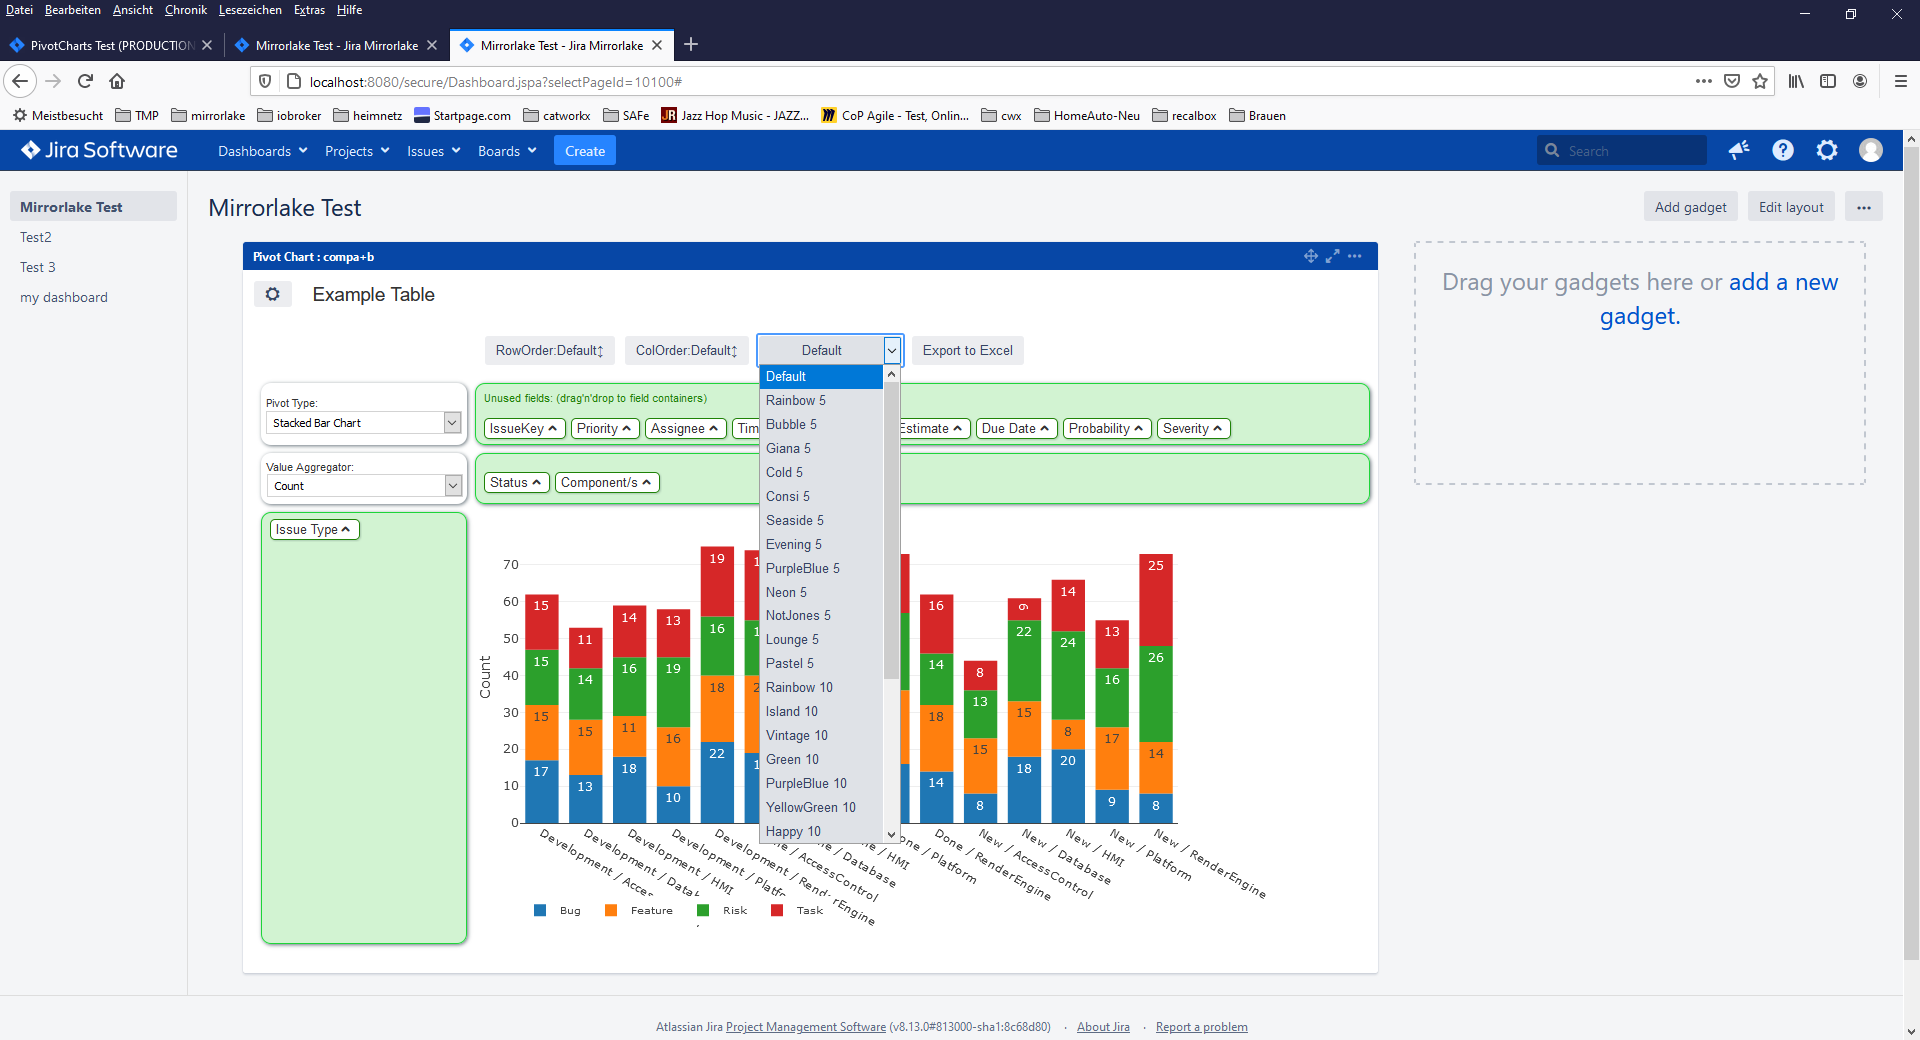
Click on the gear symbol next to the chart title to show and hide the configuration elements of the chart.
There are two containers to define the horizontal and vertical dimension of the pivot renderer. Drag & drop fields from the "unused container" to the vertical/horizontal field container.
Clicking on the ^ Symbol next to field names opens the field configuration.
Sorting rows+columns
Inside the field configuration the order of field values can be changed by drag&drop of values.
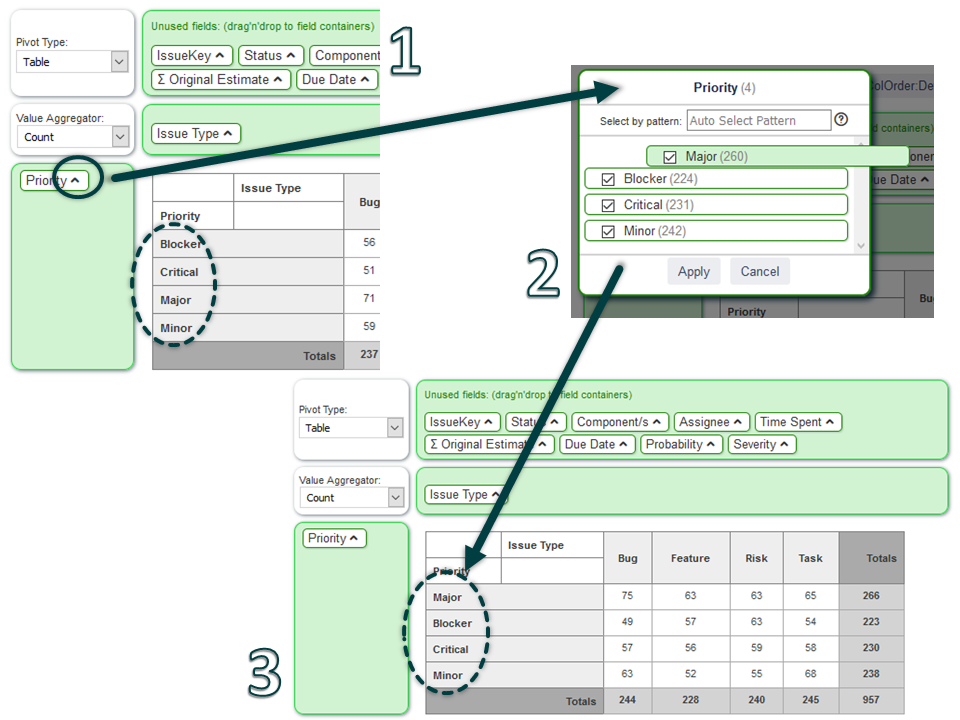
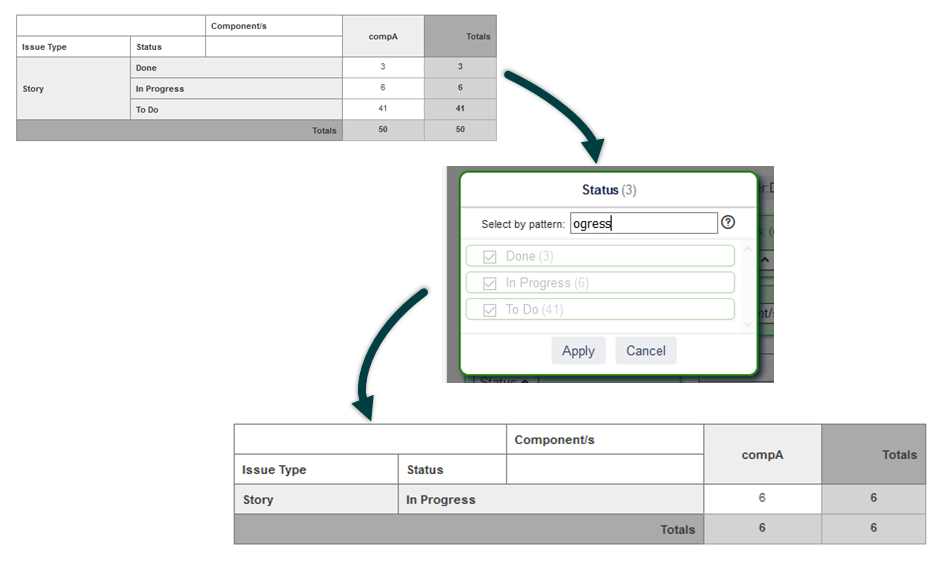
Show & hide specific values
Within the field configuration the checkboxes can be used to show and hide specific values.
Automatic selection using value pattern
It is also possible to select autmatically values by using a simple pattern match string. By entering a text pattern the chart will automaticall exlude all values that do not contain the given pattern.
For charts renderes the used colors can be adjusted by selecting on of the available Color Schemes:
Using the button "Excel: create pivot table" the shown table can be exported to Microsoft Excel. This feature was tested with Windows7 and Microsoft Office 2010 and uses an ActiveXObject which requires Internet Explorer with activated ActiveX suppport.
The button is only active for certain renderer/aggregators (e.g. table/sum or table/count).
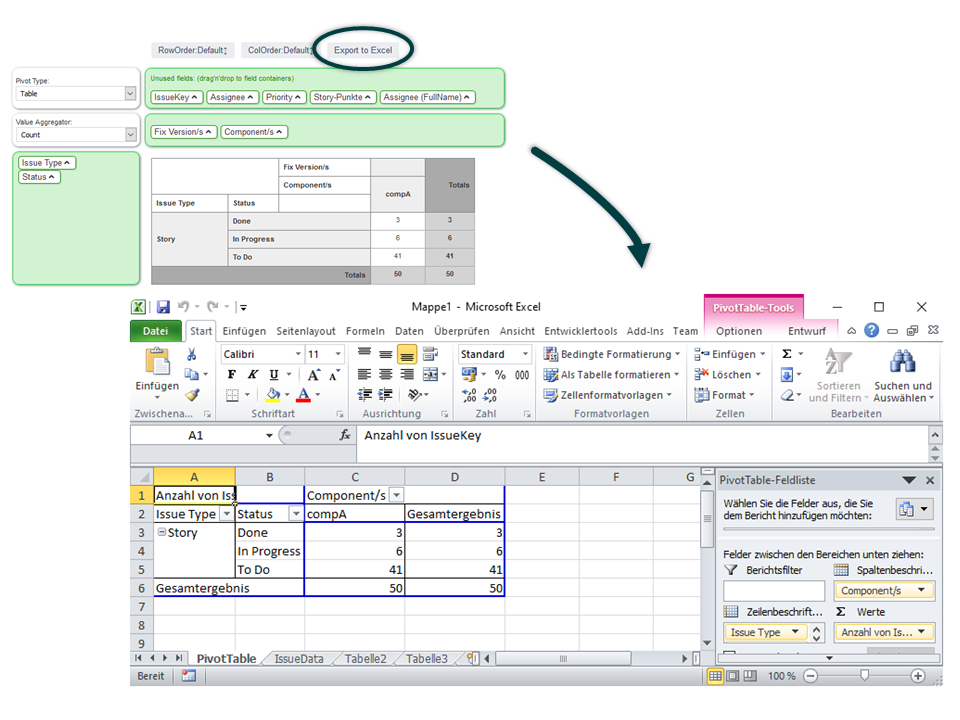
Note: this feature does not exist in Jira Cloud.
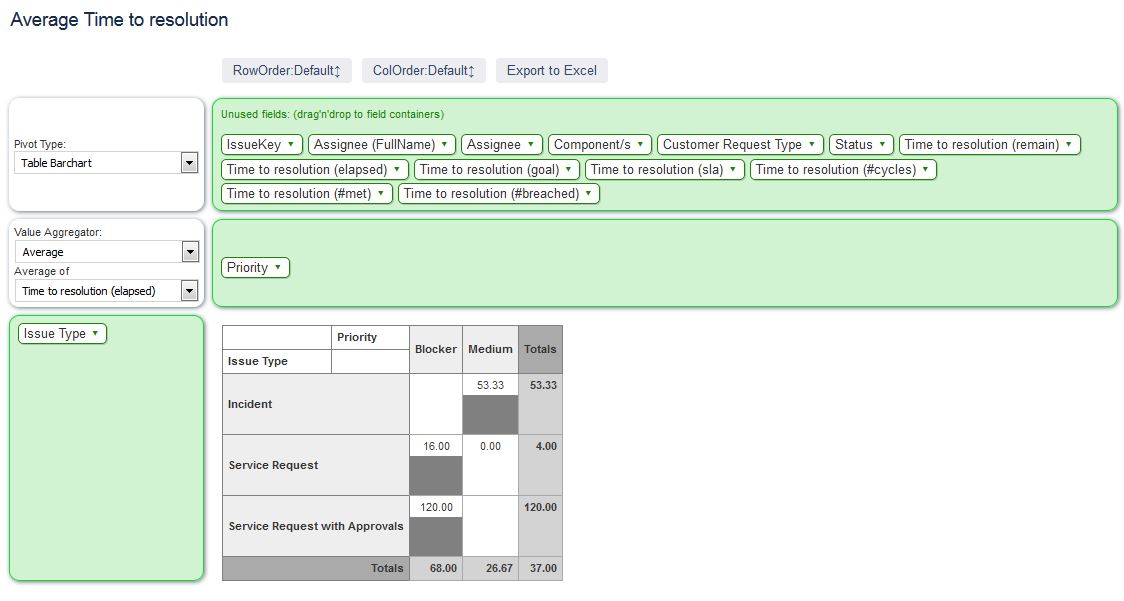
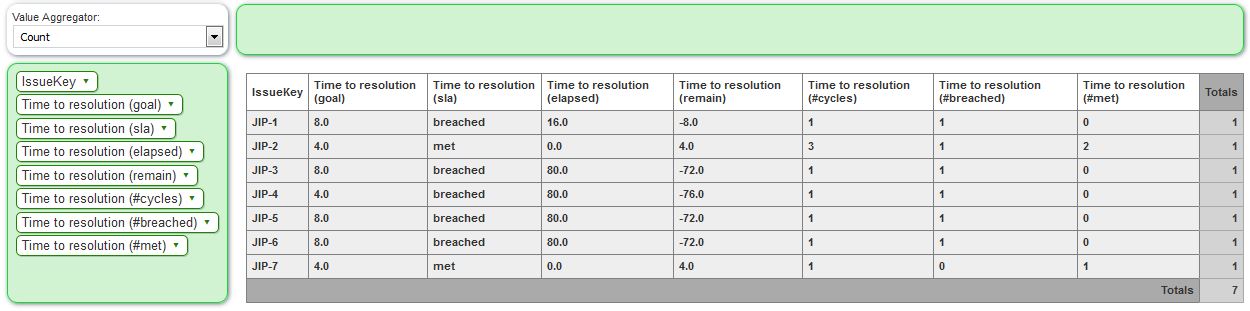
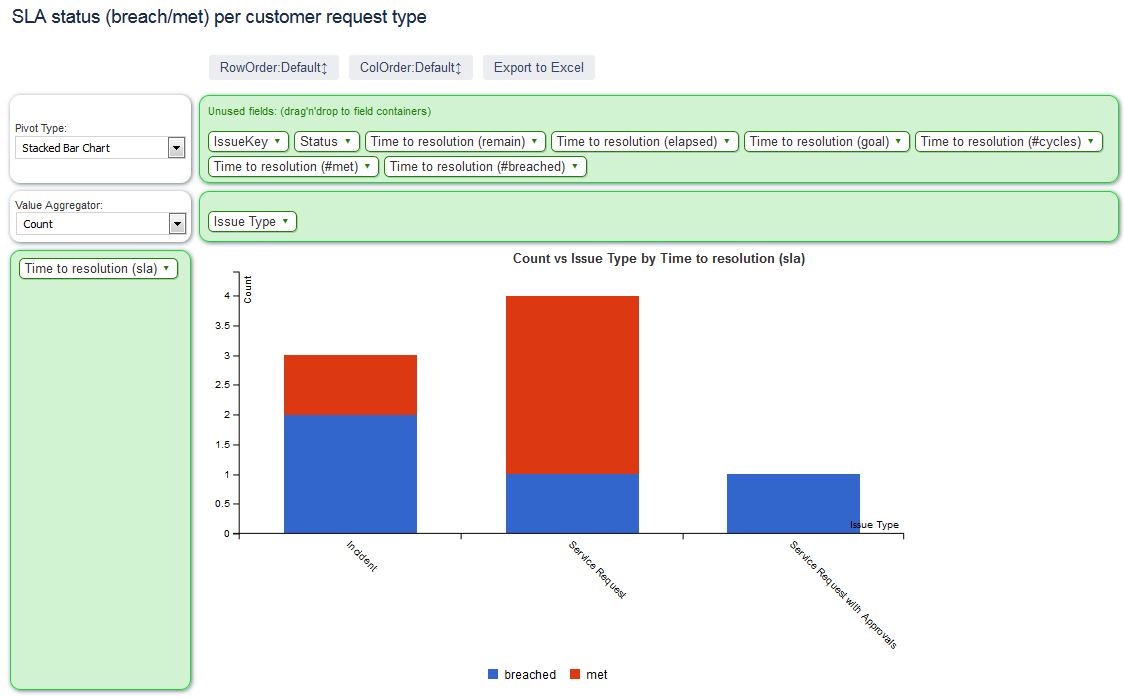
Mirrorlake Pivot Charts support Jira Service Desk fields like customer request type and SLA fields (e.g. time to resolution, time to first response etc).
Since one Jira SLA field contains a lot of useful data, one SLA field selected in the configuration will add multiple fields in the pivot chart view:
<fieldname> (sla): SLA status (breached/met) of ongoing or last completed cycle
<fieldname> (goal): SLA goal time
<fieldname> (elapsed): elapsed SLA time of ongoing or last completed cycle
<fieldname> (remaining): remaining SLA time of ongoing or last completed cycle
<fieldname> (#cycles): amount of cycles (breached and met)
<fieldname> (#breached): amount cycles where SLA was breached
<fieldname> (#met): amount of cycles where SLA was met
Example: SLA Details per issue
Example: SLA status per customer request type
Example: SLA met per user and month
Example: Average time to resolution