Welcome
Welcome to the Wiki of the Mirrorlake PivotCharts Plugin for Jira®!
Pls find more information at below links:
This page: documentation about the plugins features
Atlassian® Marketplace: Our plugin at the Atlassian® Marketplace
Issue Tracker: submit feature requests and bug reports here
If you want to know more about mirrorlake software, pls. visit our website: http://www.mirrorlake.eu
For any other question just write to support@mirrorlake.eu
Introduction
How to install the plugin
Pls visit the plugins marketplace page and find an installation instruction here. Note, that you adjust the hosting options on the roght side to either "Server", "Data Center" or "Cloud" depending on your Jira instance type.
How to setup an initial chart
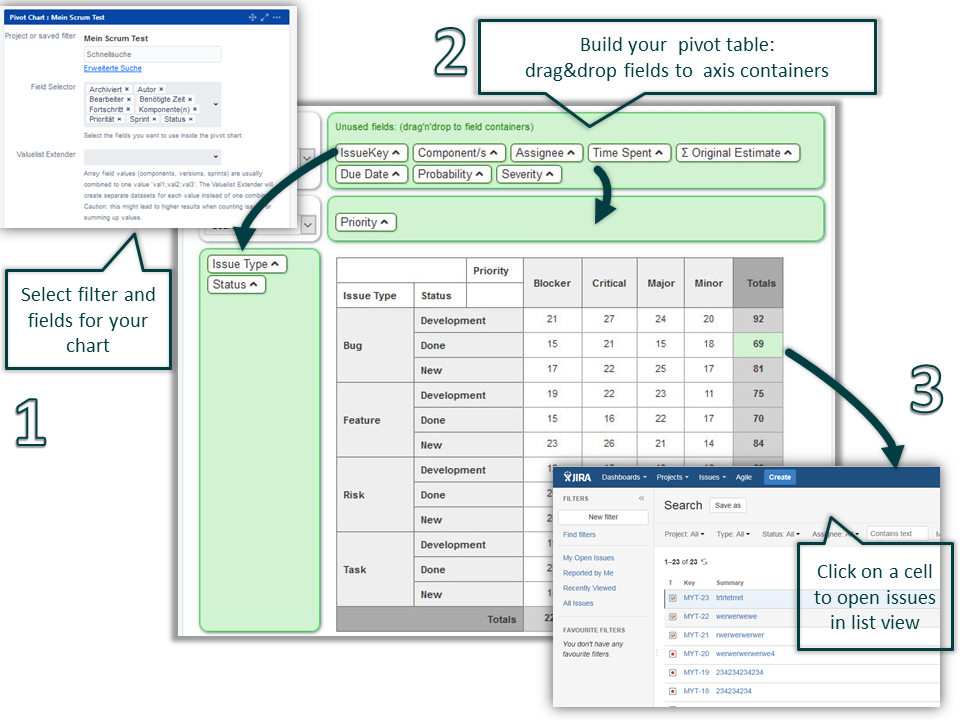
To create a chart the following steps are required:
Create a new or open an existing Jira® dashboard
Click on "add gadget", select "Mirrorlake PivotCharts" gadget from the list
In the plugin configuration screen select a filter and click "save"
Click on a cell to open related list of issues.
PivotChart gadget explained
Overview
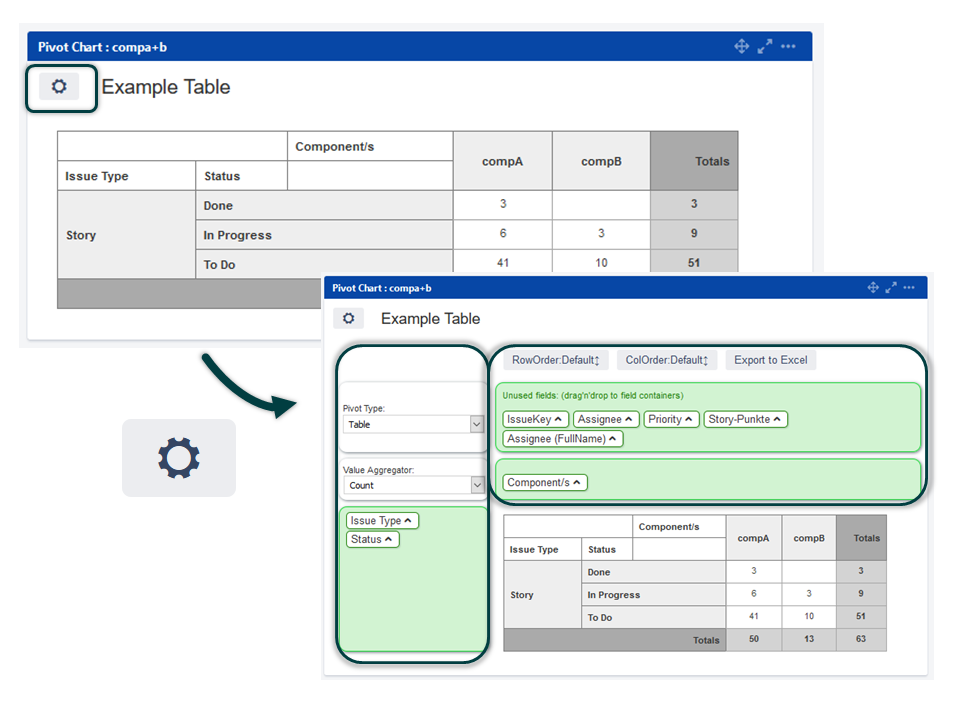
Open the chart configuration
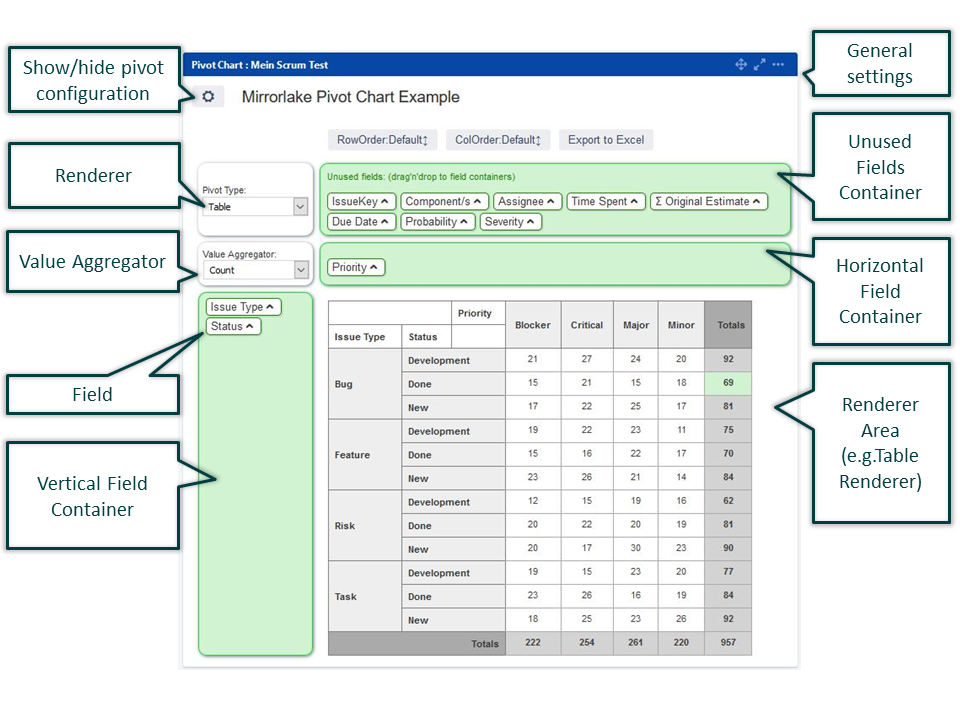
A pivot table or chart can be adjusted using the pivot configuration which can be shown and hidden by clicking the configuration button (gear symbol) next to the chart title.
Renderers
A renderer visualizes the data of your pivot table. The following renderers are available:
Table
Table Barchart
Row Heatmap
Col Heatmap
Horizonatal Bar Chart
Horizontal Stacked Bar Chart
Bar Chart
Stacked Bar Chart
Line Chart
Area Chart
Scatter Chart
Multiple Pie Chart
Bubble Chart
Aggregators
The aggregator is used to determine the calculation method used for the table cells.
Count
Count Unique Values
List Unique Values
List All Values
Sum
Integer Sum
Average
Median
Trimmed Mean 10% (calculates the average without max and min values - 10% max/min values are ignored)
Trimmed Mean 20% (calculates the average without max and min values - 20% max/min values are ignored)
Trimmed Mean 30% (calculates the average without max and min values - 30% max/min values are ignored)
Sample Variance
Sample Standard Deviation
Minimum
Maximum
First
Last
Sum over Sum
80% Upper Bound
80% Lower Bound
Sum as Fraction of Totals
Sum as Fraction of Rows
Sum as Fraction of Columns
Count as Fraction of Totals
Count as Fraction of Rows
Count as Fraction of Columns
Showing table configuration areas
Click on the gear symbol next to the chart title to show and hide the configuration elements of the chart.
Field Containers
There are two containers to define the horizontal and vertical dimension of the pivot renderer. Drag & drop fields from the "unused container" to the vertical/horizontal field container.
Field configurations (sorting, show/hide, automatic selection
Clicking on the ^ Symbol next to field names opens the field configuration.
Sorting rows+columns
Inside the field configuration the order of field values can be changed by drag&drop of values.
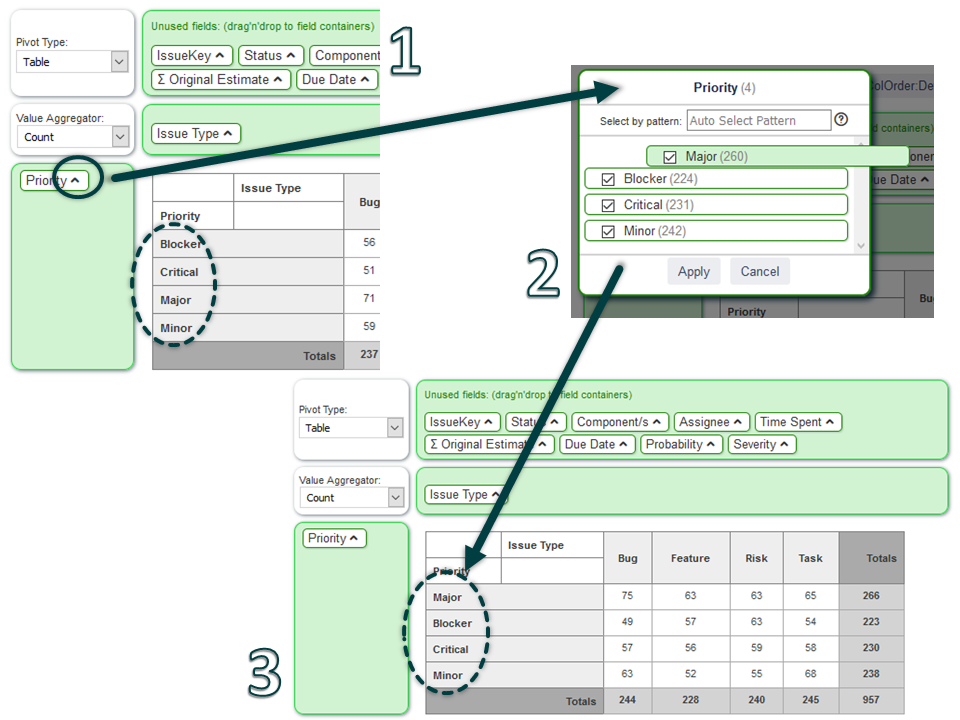
Show & hide specific values
Within the field configuration the checkboxes can be used to show and hide specific values.
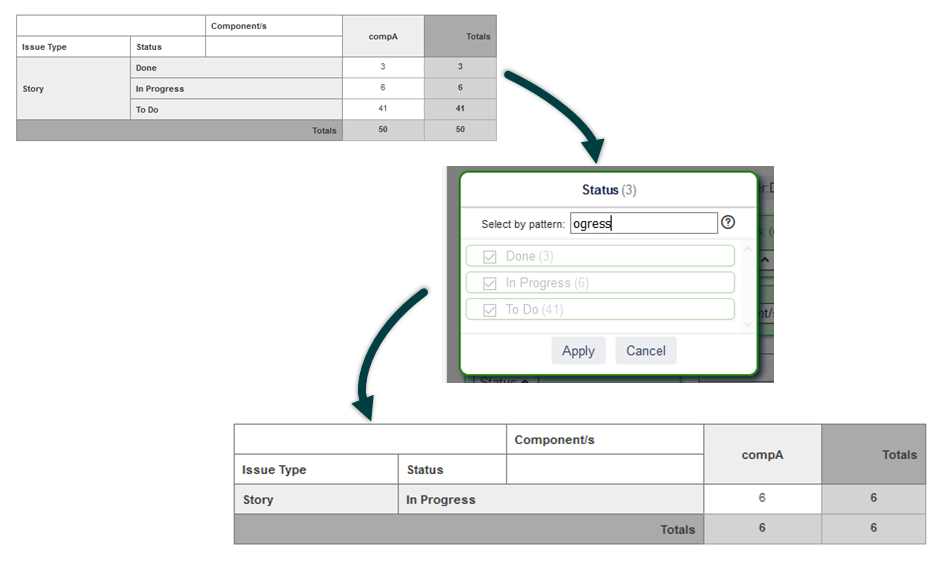
Automatic selection using value pattern
It is also possible to select autmatically values by using a simple pattern match string. By entering a text pattern the chart will automaticall exlude all values that do not contain the given pattern.
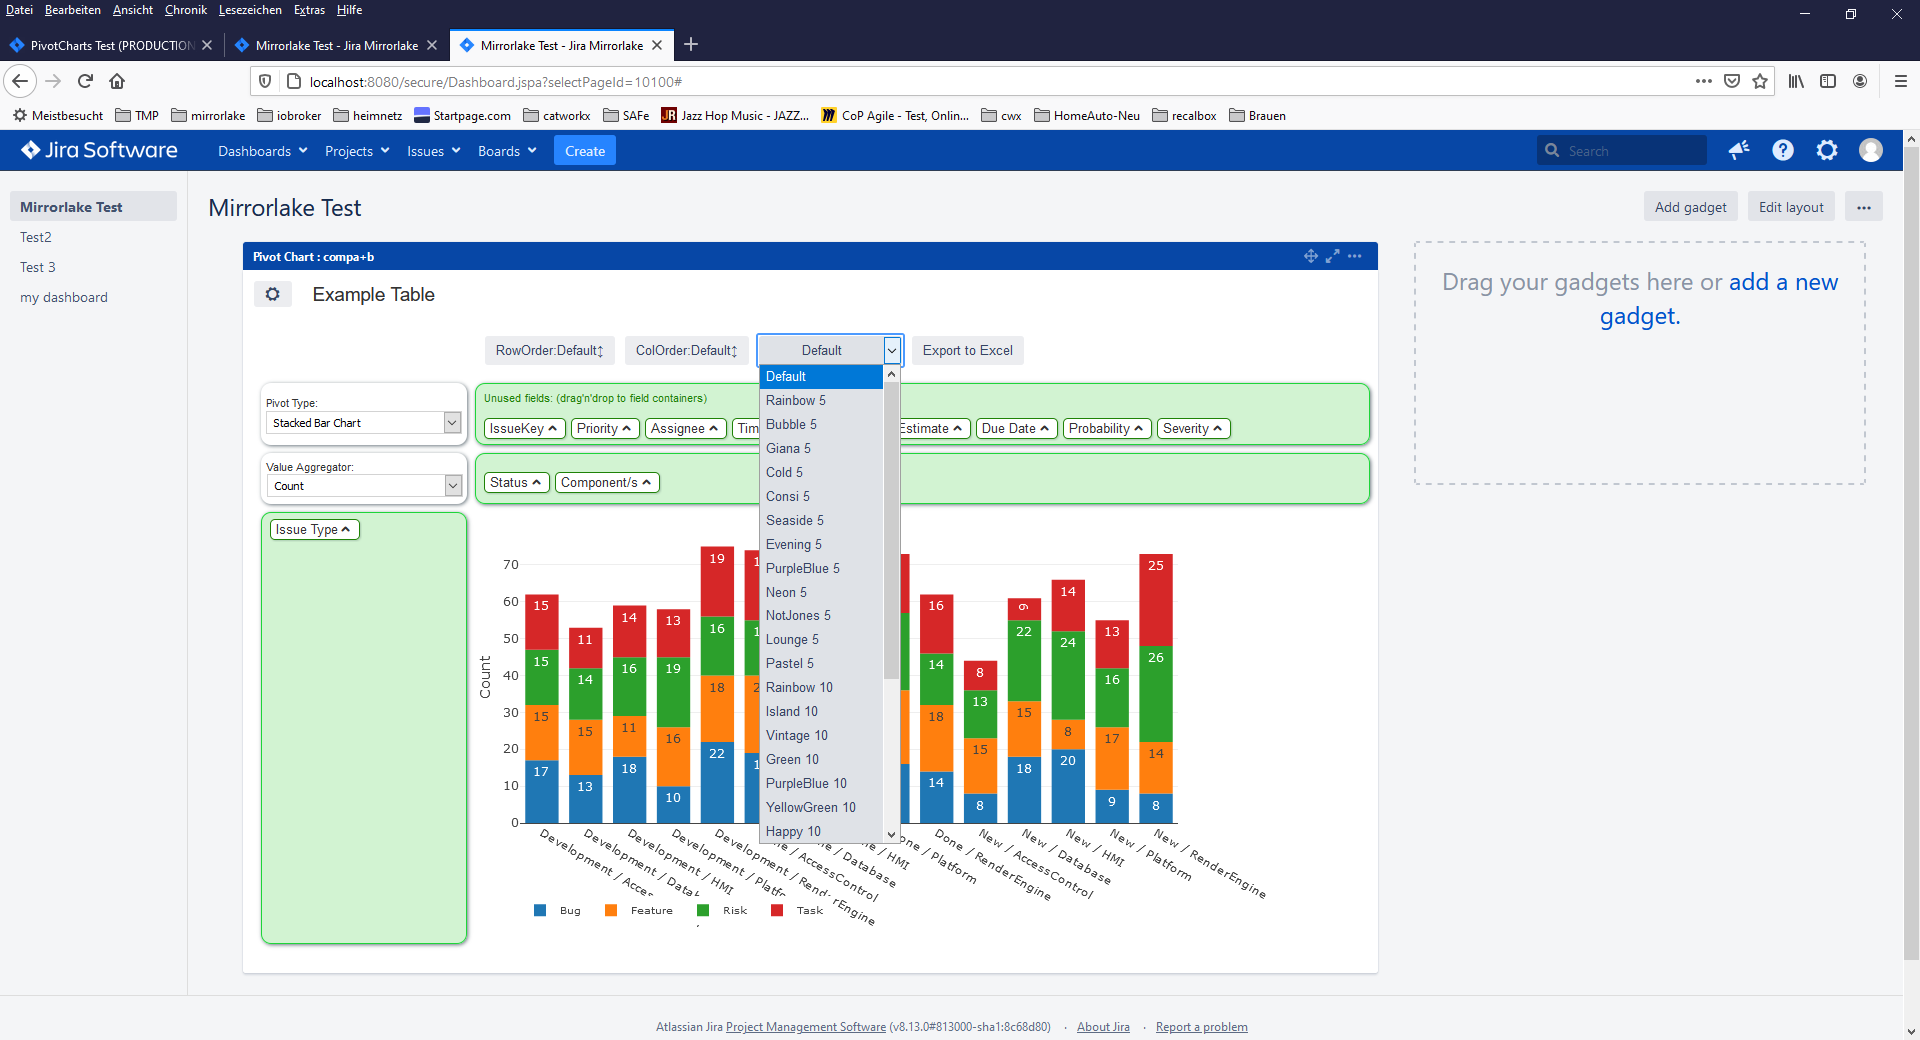
Choosing a Color Schemes
For charts renderes the used colors can be adjusted by selecting on of the available Color Schemes:
Exporting to excel
Using the button "Excel: create pivot table" the shown table can be exported to Microsoft Excel. This feature was tested with Windows7 and Microsoft Office 2010 and uses an ActiveXObject which requires Internet Explorer with activated ActiveX suppport.
The button is only active for certain renderer/aggregators (e.g. table/sum or table/count).
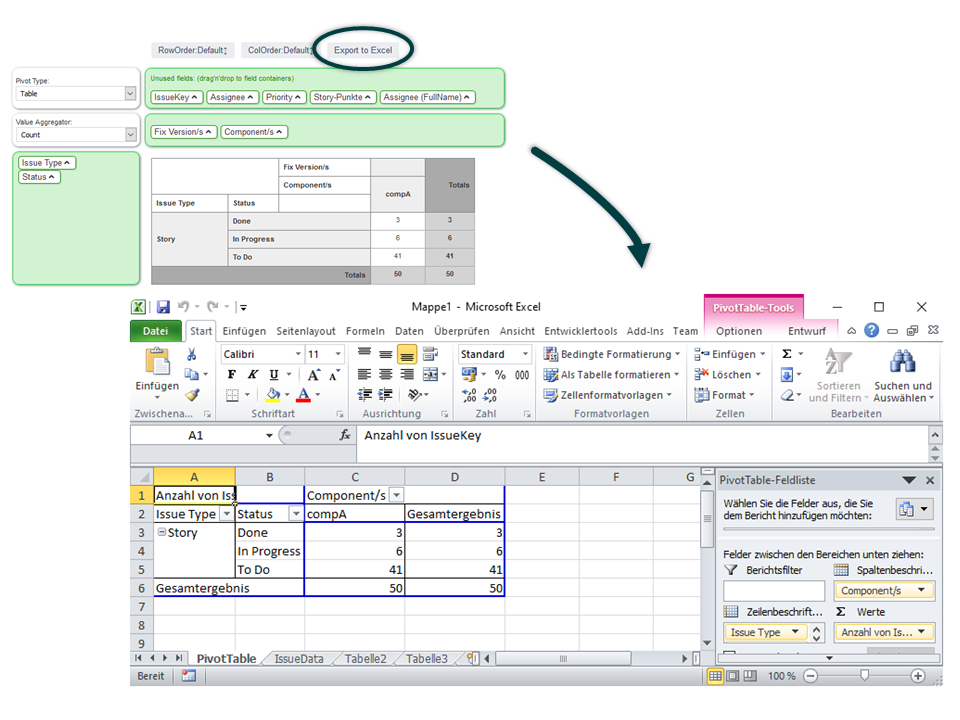
Note: this feature does not exist in Jira Cloud.
Jira Service Desk support
Mirrorlake Pivot Charts support Jira Service Desk fields like customer request type and SLA fields (e.g. time to resolution, time to first response etc).
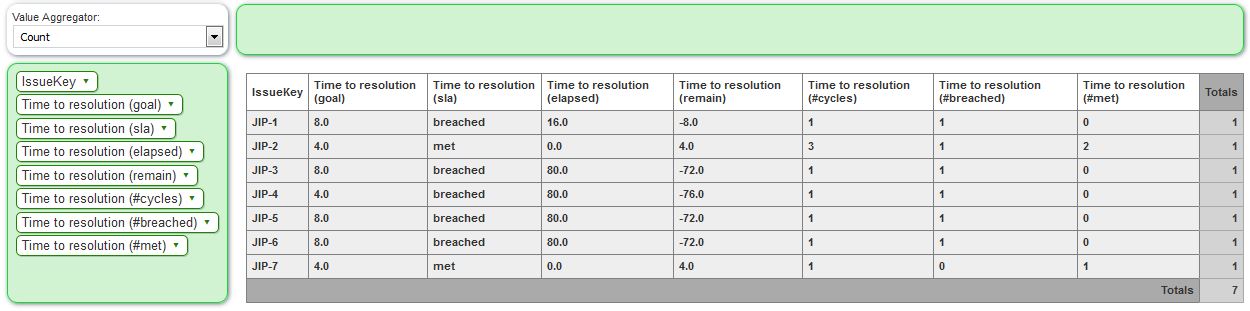
Since one Jira SLA field contains a lot of useful data, one SLA field selected in the configuration will add multiple fields in the pivot chart view:
<fieldname> (sla): SLA status (breached/met) of ongoing or last completed cycle
<fieldname> (goal): SLA goal time
<fieldname> (elapsed): elapsed SLA time of ongoing or last completed cycle
<fieldname> (remaining): remaining SLA time of ongoing or last completed cycle
<fieldname> (#cycles): amount of cycles (breached and met)
<fieldname> (#breached): amount cycles where SLA was breached
<fieldname> (#met): amount of cycles where SLA was met
Example: SLA Details per issue
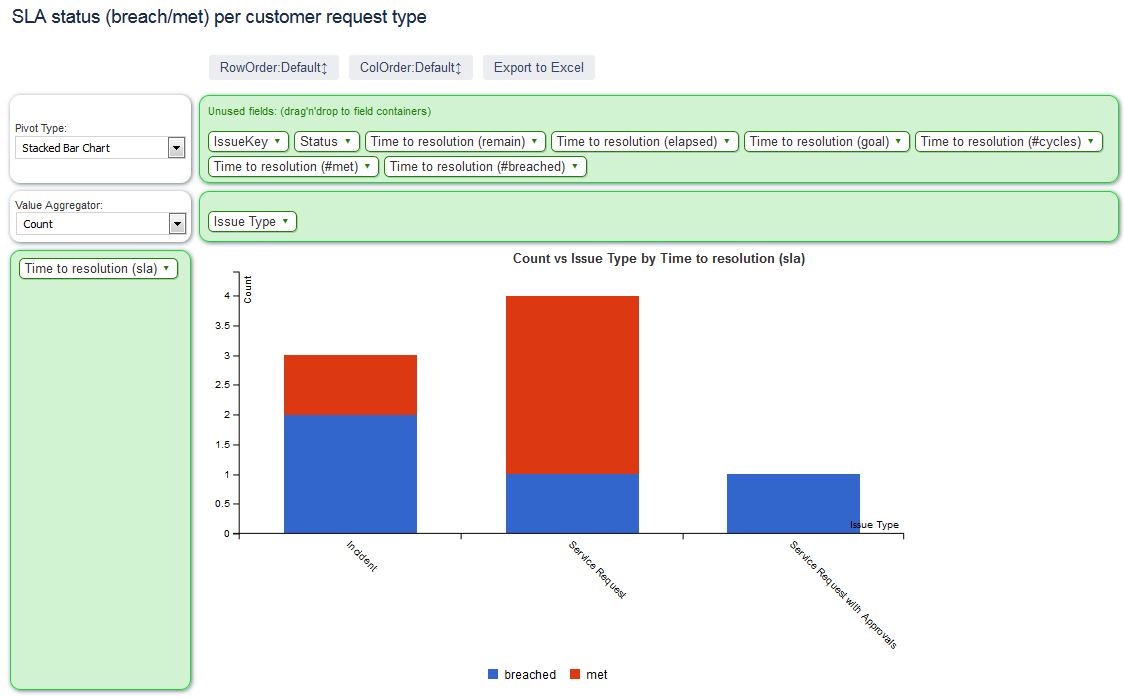
Example: SLA status per customer request type
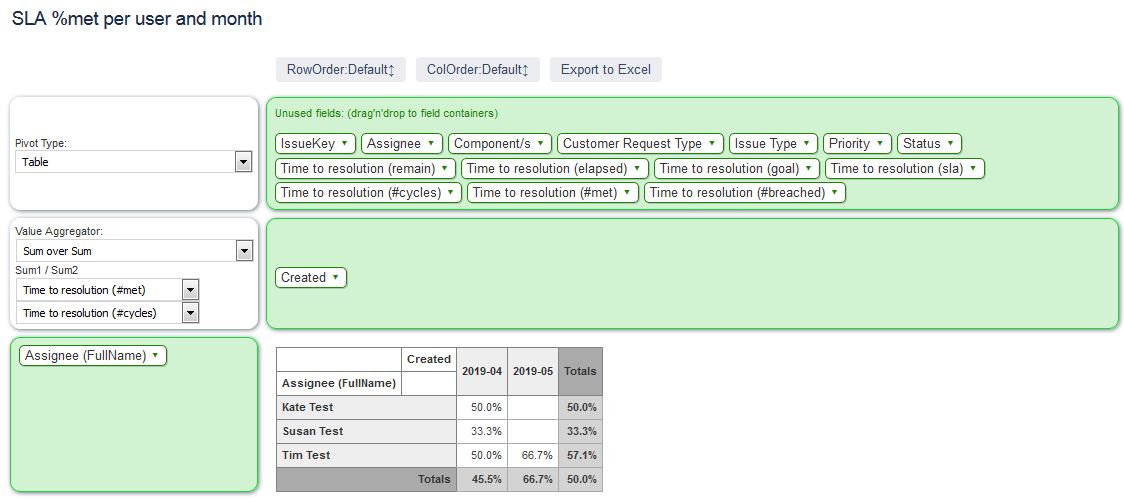
Example: SLA met per user and month
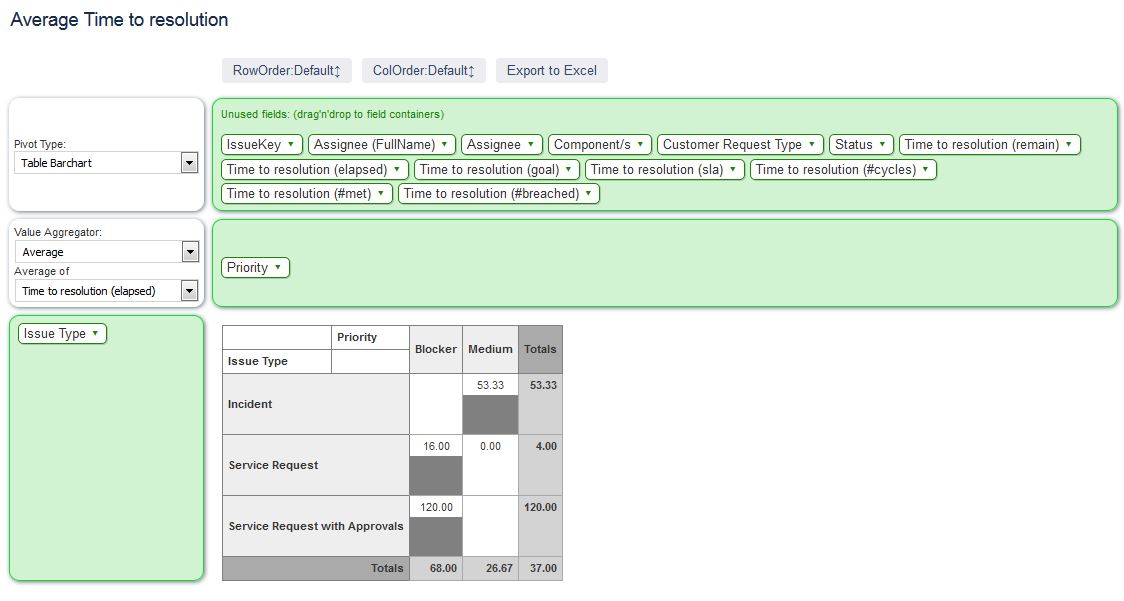
Example: Average time to resolution
General Configuration Options
The gadget configuration options can be opened by opening the "..." menu (top right corner of the gadget) and selecting "edit". Following chapters explain the options in detail.
Project or Saved Filter
The fields defines the source of tickets to be taken for the chart planned and real progress data. You can select any predefined filter availabel in Jira® or just select a specific project.
Note: the Jira Cloud version of this option does not offer the possibility of project selection.
Field selector
Used to select the issue fields you want to include in your pivot table.
Sprint fields
If sprint fields are selected, sprints will show up as combined ";"-separated values in case an issue was done in more than one sprint. Additionally also a "Sprint (latest)" is available in the pivot field container automatically, which only containes the last sprint an issue was/is assigned to.
Assignee fields
Selecting the field "Assignee will provide two assignee field to the pivot chart: one field contains the login name, one the full name.
Valuelist Extender
Array field values (components, versions, sprints) are usually combined to one value 'val1;val2;val3'. The Valuelist Extender will create separate datasets for each value instead of one combined. Caution: this might lead to higher results when counting issues or summing up values.
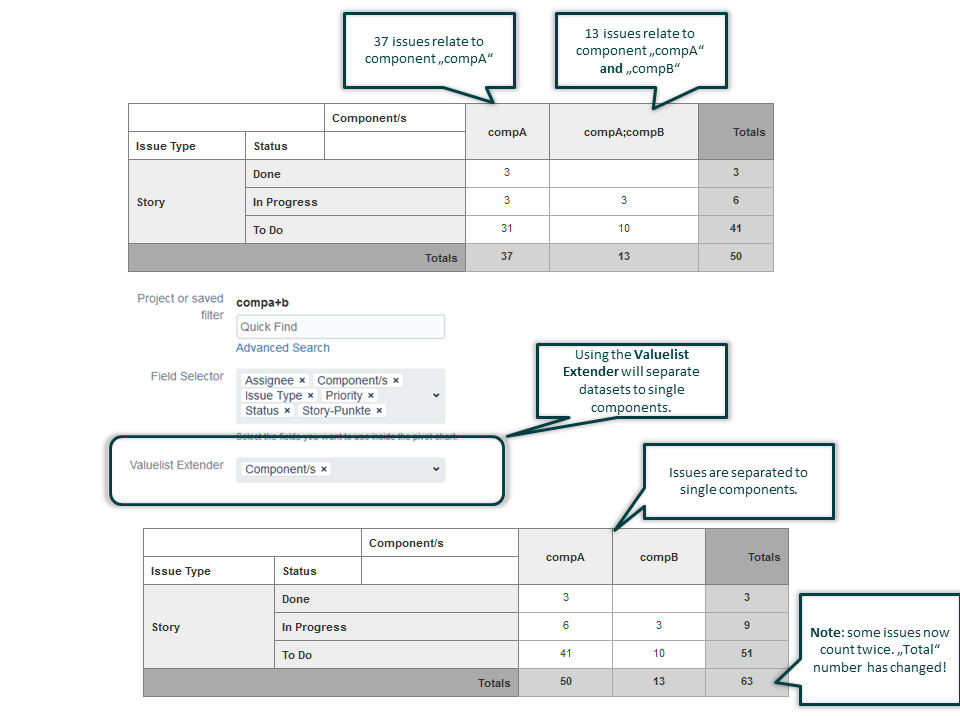
Note: this feature does not exist in Jira Cloud.
Chart Title
Define your own title for your chart to give a summery of the shown content or leave it empty for hiding any title.
Chart Height
Adjusts chart height from 40% to 140% of the original height.
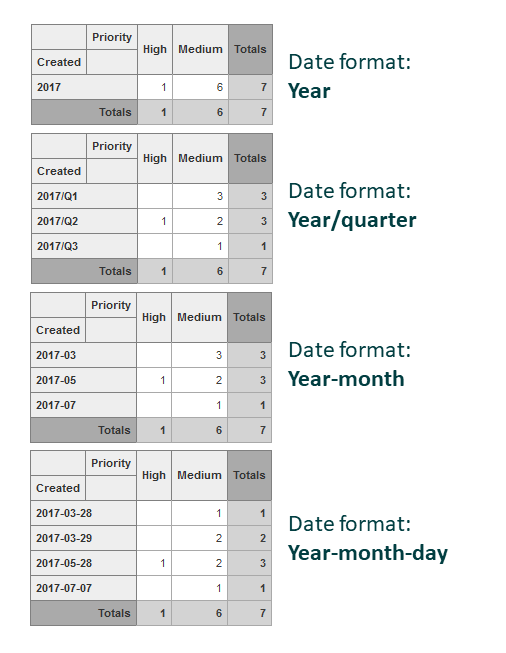
Date Format
Using the option you can define the format of dates used for your table. Available options are:
Time Unit
Configures, how values in the pivot table cells are formatted.
Table Options
These options control display of total and average values per column and row: * Show total of rows * Show total of columns * Show average of rows * Show average of columns * Average calculation: do do not count blank table cells Two average calculations exist: either all cells in the table are taken for the average or only cells containing values.
Chart Options
These options contol the layout of some chart renderers: * Show labels in bar or pie charts
Restrictions
The optin "Do not open issue list when clicking on pivot values cells" blocks the function of opening the issue list by clicking into the table cells.
Note: this feature does not exist in Jira Cloud.
Epic link names
In case Jira Software(R) is used, tasks can be linked to epics. The information of the "epic link" is just the key of the related epic issue. Activating this option lets the renderer lookup the epic names also. Additional database lookups are necessary which might slow down the creation of the pivot table. Pls report any performance issue to support@mirrorlake.eu.
Refresh interval
Enables automatic refresh when viewing the dashboard.
Note: this feature does not exist in Jira Cloud.
Limitations and Frequently asked Questions
How can I add a chart to confluence page?
You can embed a pivot chart also to confluence pages. Pls refer details follwing the below link: https://confluence.atlassian.com/doc/gadgets-204047542.html#Gadgets-AddaJiragadgettoapage
Opening list of too many Jira issues
You are able to get the list of related tickets when clicking on a chart element. The longer the list of tickets is, the longer the used URL for the ticket list will be. Theoretically there is a browser specific limit which heavily depends on your browser type and version. Pls report any issue to us.
Excel Export only working with Internet Explorer and Active X
Check the following:
use Microsoft Internet Explorer (IE)
activate ActiveX support in IE settings
use a supporter renderer/aggregator (e.g. table/sum)
Contact us at support@mirrorlake.eu for any issue and report browser and MS Office Version.
Chart is empty or "syntax error" shown
In complex configuration scenrios it could happen, that teh chart can not be loaded anymore.
Rootcause
Rootcase is a limitation in the length of the gadget configurtion stored in Jira. IF the user applies "too many and too large" configuration settings it might lead to URL messages like "Can't rewrite URL because it is too large". Also a completely empty gadget could be the result.
Fix / Avoidance Improvements could bring server side adjustments as described here:
We are working on a way to prevent too long configuration settings. From end user perspecitve you can not fix this issue, but you can create a new gadget and follow our recommendations for performance improvements (see below).
How to improve performance of dashboards
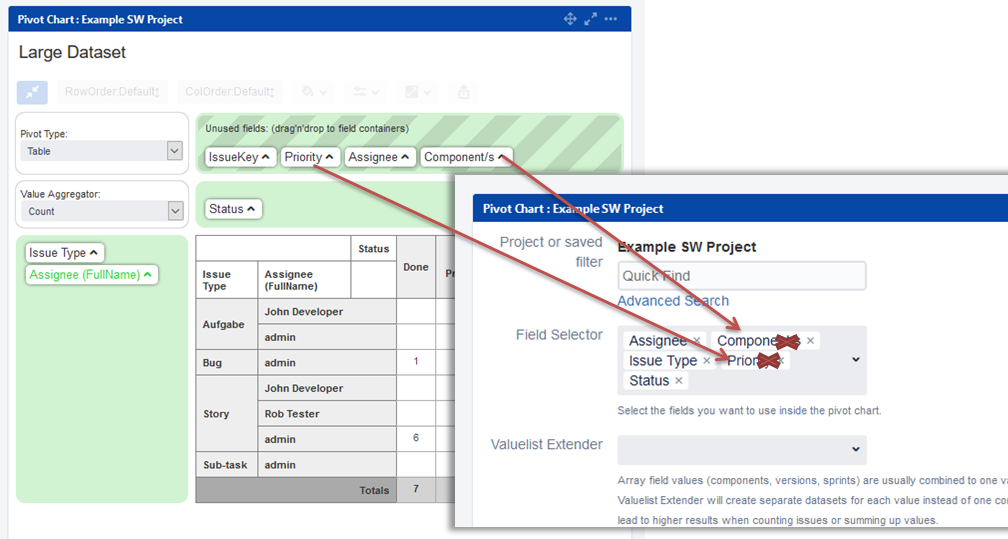
Avoid loading data of unused fields
Only select fields for your gadget configuration, that you really need for building tables or charts. If you have fields in the "unused field container" you can remove the field from the chart configuration page.
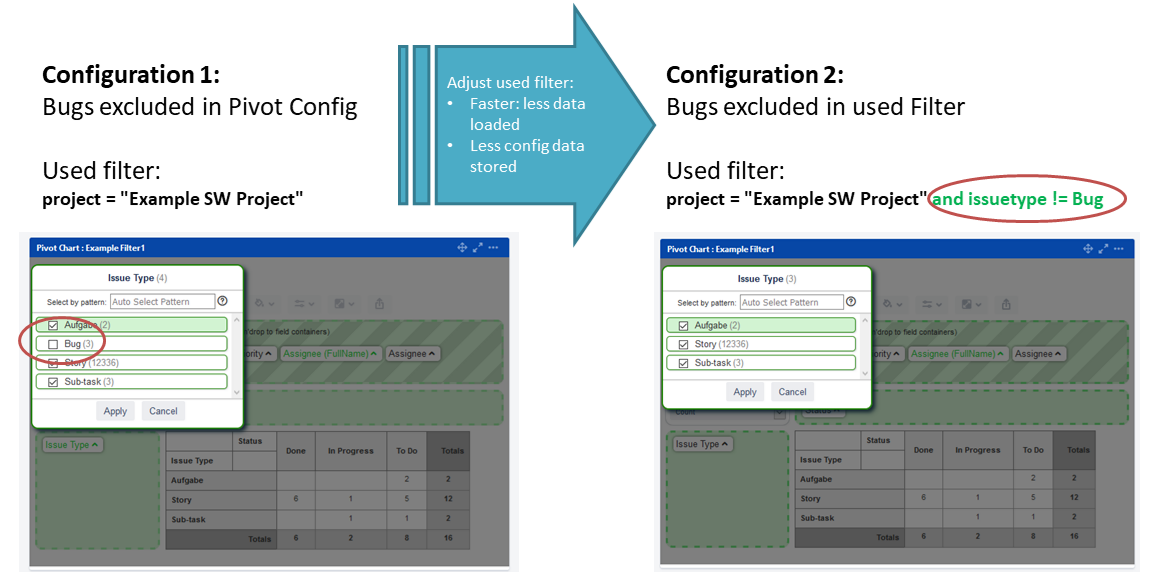
Do not load data excluded in chart configuration
The field containers allow to deselect usage of certain field values. Massive use of this options carries two problems:
The field data initially loaded by the chart is not reduced by this option. From performance perspective it is recommended to reduce loaded data adjusting the used filter and exclude issues showing these values.
There is a limitation of configuration length that can be stored by the chart. If too many values especially of a larger length are deselcted in the chart, the configuration storage space could be exceeded and the chart could have problems to be shown with the next browser refresh. This problem is know and being fixed soon. As a workaround pls adjust the JQL and reduce usage of field value selection in the pivot GUI as shown below:
Used 3rd party IP
base64_decode.js base64_encode.js
https://github.com/kvz/locutus
Copyright (c) 2007-2016 Kevin van Zonneveld (http://kvz.io ) and Contributors (http://locutus.io/authors )
Permission is hereby granted, free of charge, to any person obtaining a copy of this software and associated documentation files (the "Software"), to deal in the Software without restriction, including without limitation the rights to use, copy, modify, merge, publish, distribute, sublicense, and/or sell copies of the Software, and to permit persons to whom the Software is furnished to do so, subject to the following conditions:
The above copyright notice and this permission notice shall be included in all copies or substantial portions of the Software.
THE SOFTWARE IS PROVIDED "AS IS", WITHOUT WARRANTY OF ANY KIND, EXPRESS OR IMPLIED, INCLUDING BUT NOT LIMITED TO THE WARRANTIES OF MERCHANTABILITY, FITNESS FOR A PARTICULAR PURPOSE AND NONINFRINGEMENT. IN NO EVENT SHALL THE AUTHORS OR COPYRIGHT HOLDERS BE LIABLE FOR ANY CLAIM, DAMAGES OR OTHER LIABILITY, WHETHER IN AN ACTION OF CONTRACT, TORT OR OTHERWISE, ARISING FROM, OUT OF OR IN CONNECTION WITH THE SOFTWARE OR THE USE OR OTHER DEALINGS IN THE SOFTWARE.
D3.js
https://github.com/d3/d3 Copyright 2010-2016 Mike Bostock All rights reserved. Redistribution and use in source and binary forms, with or without modification,are permitted provided that the following conditions are met: * Redistributions of source code must retain the above copyright notice, this list of conditions and the following disclaimer. * Redistributions in binary form must reproduce the above copyright notice, this list of conditions and the following disclaimer in the documentation and/or other materials provided with the distribution. * Neither the name of the author nor the names of contributors may be used to endorse or promote products derived from this software without specific prior written permission. THIS SOFTWARE IS PROVIDED BY THE COPYRIGHT HOLDERS AND CONTRIBUTORS "AS IS" ANDANY EXPRESS OR IMPLIED WARRANTIES, INCLUDING, BUT NOT LIMITED TO, THE IMPLIED WARRANTIES OF MERCHANTABILITY AND FITNESS FOR A PARTICULAR PURPOSE ARE DISCLAIMED. IN NO EVENT SHALL THE COPYRIGHT OWNER OR CONTRIBUTORS BE LIABLE FOR ANY DIRECT, INDIRECT, INCIDENTAL, SPECIAL, EXEMPLARY, OR CONSEQUENTIAL DAMAGES (INCLUDING, BUT NOT LIMITED TO, PROCUREMENT OF SUBSTITUTE GOODS OR SERVICES; LOSS OF USE, DATA, OR PROFITS; OR BUSINESS INTERRUPTION) HOWEVER CAUSED AND ON ANY THEORY OF LIABILITY, WHETHER IN CONTRACT, STRICT LIABILITY, OR TORT (INCLUDING NEGLIGENCE OR OTHERWISE) ARISING IN ANY WAY OUT OF THE USE OF THIS SOFTWARE, EVEN IF ADVISED OF THE POSSIBILITY OF SUCH DAMAGE.
C3.js
The MIT License (MIT) Copyright (c) 2013 Masayuki Tanaka Permission is hereby granted, free of charge, to any person obtaining a copy of this software and associated documentation files (the "Software"), to deal in the Software without restriction, including without limitation the rights to use, copy, modify, merge, publish, distribute, sublicense, and/or sell copies of the Software, and to permit persons to whom the Software is furnished to do so, subject to the following conditions: The above copyright notice and this permission notice shall be included in all copies or substantial portions of the Software. THE SOFTWARE IS PROVIDED "AS IS", WITHOUT WARRANTY OF ANY KIND, EXPRESS OR IMPLIED, INCLUDING BUT NOT LIMITED TO THE WARRANTIES OF MERCHANTABILITY, FITNESS FOR A PARTICULAR PURPOSE AND NONINFRINGEMENT. IN NO EVENT SHALL THE AUTHORS OR COPYRIGHT HOLDERS BE LIABLE FOR ANY CLAIM, DAMAGES OR OTHER LIABILITY, WHETHER IN AN ACTION OF CONTRACT, TORT OR OTHERWISE, ARISING FROM, OUT OF OR IN CONNECTION WITH THE SOFTWARE OR THE USE OR OTHER DEALINGS IN THE SOFTWARE.
PivotTable.js
https://github.com/nicolaskruchten/pivottable (MIT License) PivotTable.js is © 2012-2013 Nicolas Kruchten, Datacratic, other contributors Permission is hereby granted, free of charge, to any person obtaining a copy of this software and associated documentation files (the "Software"), to deal in the Software without restriction, including without limitation the rights to use, copy, modify, merge, publish, distribute, sublicense, and/or sell copies of the Software, and to permit persons to whom the Software is furnished to do so, subject to the following conditions: The above copyright notice and this permission notice shall be included in all copies or substantial portions of the Software. THE SOFTWARE IS PROVIDED "AS IS", WITHOUT WARRANTY OF ANY KIND, EXPRESS OR IMPLIED, INCLUDING BUT NOT LIMITED TO THE WARRANTIES OF MERCHANTABILITY, FITNESS FOR A PARTICULAR PURPOSE AND NONINFRINGEMENT. IN NO EVENT SHALL THE AUTHORS OR COPYRIGHT HOLDERS BE LIABLE FOR ANY CLAIM, DAMAGES OR OTHER LIABILITY, WHETHER IN AN ACTION OF CONTRACT, TORT OR OTHERWISE, ARISING FROM, OUT OF OR IN CONNECTION WITH THE SOFTWARE OR THE USE OR OTHER DEALINGS IN THE SOFTWARE.
Plotly.js https://github.com/plotly/plotly.js
The MIT License (MIT)
Copyright (c) 2019 Plotly, Inc
Permission is hereby granted, free of charge, to any person obtaining a copy of this software and associated documentation files (the "Software"), to deal in the Software without restriction, including without limitation the rights to use, copy, modify, merge, publish, distribute, sublicense, and/or sell copies of the Software, and to permit persons to whom the Software is furnished to do so, subject to the following conditions:
The above copyright notice and this permission notice shall be included in all copies or substantial portions of the Software.
THE SOFTWARE IS PROVIDED "AS IS", WITHOUT WARRANTY OF ANY KIND, EXPRESS OR IMPLIED, INCLUDING BUT NOT LIMITED TO THE WARRANTIES OF MERCHANTABILITY, FITNESS FOR A PARTICULAR PURPOSE AND NONINFRINGEMENT. IN NO EVENT SHALL THE AUTHORS OR COPYRIGHT HOLDERS BE LIABLE FOR ANY CLAIM, DAMAGES OR OTHER LIABILITY, WHETHER IN AN ACTION OF CONTRACT, TORT OR OTHERWISE, ARISING FROM, OUT OF OR IN CONNECTION WITH THE SOFTWARE OR THE USE OR OTHER DEALINGS IN THE SOFTWARE.
jquery
Copyright jQuery Foundation and other contributors, https://jquery.org/ This software consists of voluntary contributions made by many individuals. For exact contribution history, see the revision history available at https://github.com/jquery/jquery-ui The following license applies to all parts of this software except as documented below:
Permission is hereby granted, free of charge, to any person obtaining a copy of this software and associated documentation files (the "Software"), to deal in the Software without restriction, including without limitation the rights to use, copy, modify, merge, publish, distribute, sublicense, and/or sell copies of the Software, and to permit persons to whom the Software is furnished to do so, subject to the following conditions: The above copyright notice and this permission notice shall be included in all copies or substantial portions of the Software. THE SOFTWARE IS PROVIDED "AS IS", WITHOUT WARRANTY OF ANY KIND, EXPRESS OR IMPLIED, INCLUDING BUT NOT LIMITED TO THE WARRANTIES OF MERCHANTABILITY, FITNESS FOR A ARTICULAR PURPOSE AND NONINFRINGEMENT. IN NO EVENT SHALL THE AUTHORS OR COPYRIGHT HOLDERS BE LIABLE FOR ANY CLAIM, DAMAGES OR OTHER LIABILITY, WHETHER IN AN ACTION OF CONTRACT, TORT OR OTHERWISE, ARISING FROM, OUT OF OR IN CONNECTION WITH THE SOFTWARE OR THE USE OR OTHER DEALINGS IN THE SOFTWARE.
jQuery-MultiSelect Patrick Springstubbe https://github.com/nobleclem/jQuery-MultiSelect http://springstubbe.us
The MIT License (MIT)
Copyright (c) 2014
Permission is hereby granted, free of charge, to any person obtaining a copy of this software and associated documentation files (the "Software"), to deal in the Software without restriction, including without limitation the rights to use, copy, modify, merge, publish, distribute, sublicense, and/or sell copies of the Software, and to permit persons to whom the Software is furnished to do so, subject to the following conditions:
The above copyright notice and this permission notice shall be included in all copies or substantial portions of the Software.
THE SOFTWARE IS PROVIDED "AS IS", WITHOUT WARRANTY OF ANY KIND, EXPRESS OR IMPLIED, INCLUDING BUT NOT LIMITED TO THE WARRANTIES OF MERCHANTABILITY, FITNESS FOR A PARTICULAR PURPOSE AND NONINFRINGEMENT. IN NO EVENT SHALL THE AUTHORS OR COPYRIGHT HOLDERS BE LIABLE FOR ANY CLAIM, DAMAGES OR OTHER LIABILITY, WHETHER IN AN ACTION OF CONTRACT, TORT OR OTHERWISE, ARISING FROM, OUT OF OR IN CONNECTION WITH THE SOFTWARE OR THE USE OR OTHER DEALINGS IN THE SOFTWARE.
CSS Element Queries http://marcj.github.io/css-element-queries/
Copyright (c) 2013 Marc J. Schmidt
Permission is hereby granted, free of charge, to any person obtaining a copy of this software and associated documentation files (the "Software"), to deal in the Software without restriction, including without limitation the rights to use, copy, modify, merge, publish, distribute, sublicense, and/or sell copies of the Software, and to permit persons to whom the Software is furnished to do so, subject to the following conditions:
The above copyright notice and this permission notice shall be included in all copies or substantial portions of the Software.
THE SOFTWARE IS PROVIDED "AS IS", WITHOUT WARRANTY OF ANY KIND, EXPRESS OR IMPLIED, INCLUDING BUT NOT LIMITED TO THE WARRANTIES OF MERCHANTABILITY, FITNESS FOR A PARTICULAR PURPOSE AND NONINFRINGEMENT. IN NO EVENT SHALL THE AUTHORS OR COPYRIGHT HOLDERS BE LIABLE FOR ANY CLAIM, DAMAGES OR OTHER LIABILITY, WHETHER IN AN ACTION OF CONTRACT, TORT OR OTHERWISE, ARISING FROM, OUT OF OR IN CONNECTION WITH THE SOFTWARE OR THE USE OR OTHER DEALINGS IN THE SOFTWARE.