General Configuration Options
The gadget configuration options can be opened by opening the "..." menu (top right corner of the gadget) and selecting "edit". Following chapters explain the options in detail.
Project or Saved Filter
The fields defines the source of tickets to be taken for the chart planned and real progress data. You can select any predefined filter availabel in Jira® or just select a specific project.
Note: the Jira Cloud version of this option does not offer the possibility of project selection.
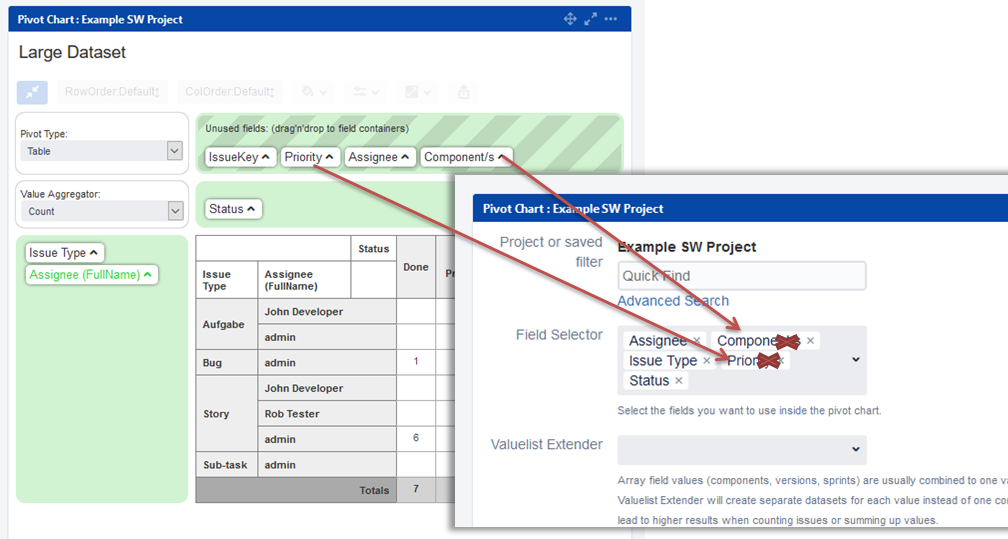
Field selector
Used to select the issue fields you want to include in your pivot table.
Sprint fields
If sprint fields are selected, sprints will show up as combined ";"-separated values in case an issue was done in more than one sprint. Additionally also a "Sprint (latest)" is available in the pivot field container automatically, which only containes the last sprint an issue was/is assigned to.
Assignee fields
Selecting the field "Assignee will provide two assignee field to the pivot chart: one field contains the login name, one the full name.
Valuelist Extender
Array field values (components, versions, sprints) are usually combined to one value 'val1;val2;val3'. The Valuelist Extender will create separate datasets for each value instead of one combined. Caution: this might lead to higher results when counting issues or summing up values.
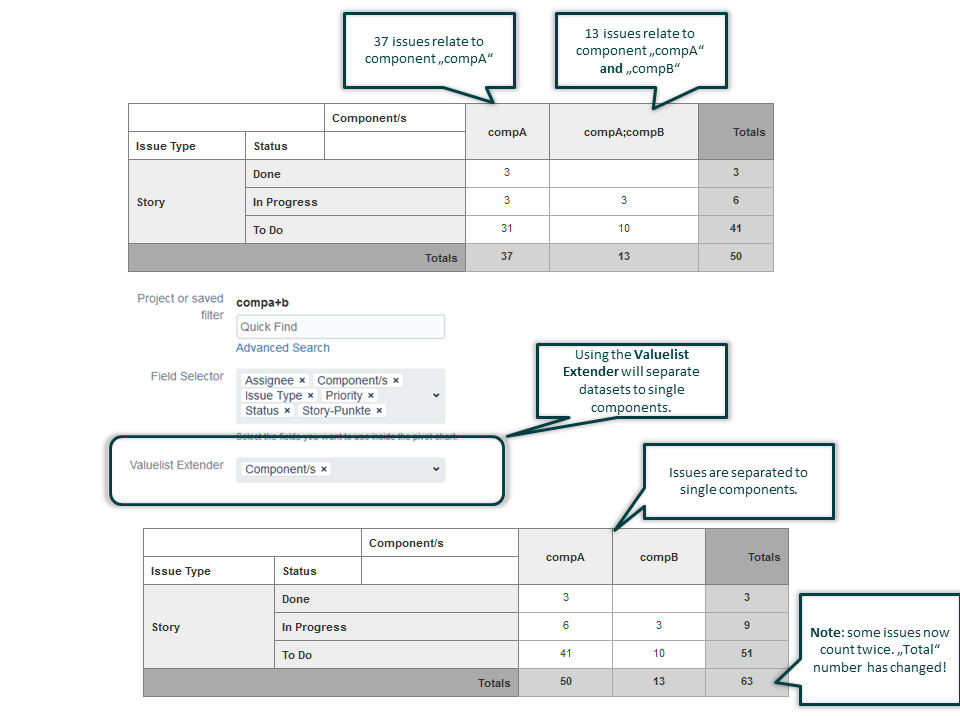
Note: this feature does not exist in Jira Cloud.
Chart Title
Define your own title for your chart to give a summery of the shown content or leave it empty for hiding any title.
Chart Height
Adjusts chart height from 40% to 140% of the original height.
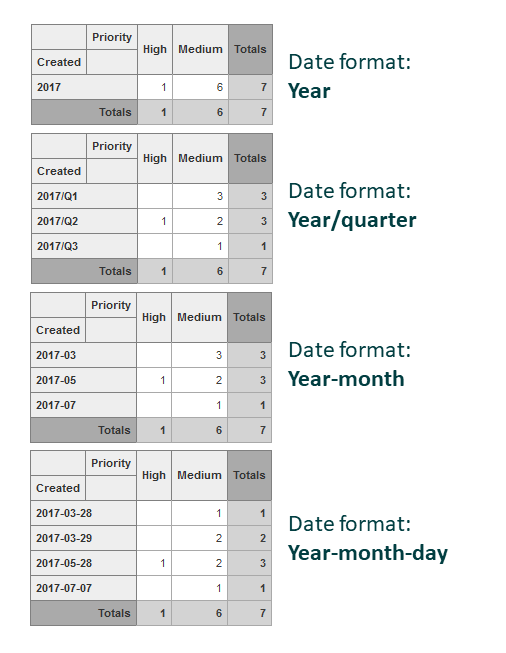
Date Format
Using the option you can define the format of dates used for your table. Available options are:
Time Unit
Configures, how values in the pivot table cells are formatted.
Table Options
These options control display of total and average values per column and row: * Show total of rows * Show total of columns * Show average of rows * Show average of columns * Average calculation: do do not count blank table cells Two average calculations exist: either all cells in the table are taken for the average or only cells containing values.
Chart Options
These options contol the layout of some chart renderers: * Show labels in bar or pie charts
Restrictions
The optin "Do not open issue list when clicking on pivot values cells" blocks the function of opening the issue list by clicking into the table cells.
Note: this feature does not exist in Jira Cloud.
Epic link names
In case Jira Software(R) is used, tasks can be linked to epics. The information of the "epic link" is just the key of the related epic issue. Activating this option lets the renderer lookup the epic names also. Additional database lookups are necessary which might slow down the creation of the pivot table. Pls report any performance issue to support@mirrorlake.eu.
Refresh interval
Enables automatic refresh when viewing the dashboard.
Note: this feature does not exist in Jira Cloud.
Limitations and Frequently asked Questions
How can I add a chart to confluence page?
You can embed a pivot chart also to confluence pages. Pls refer details follwing the below link: https://confluence.atlassian.com/doc/gadgets-204047542.html#Gadgets-AddaJiragadgettoapage
Opening list of too many Jira issues
You are able to get the list of related tickets when clicking on a chart element. The longer the list of tickets is, the longer the used URL for the ticket list will be. Theoretically there is a browser specific limit which heavily depends on your browser type and version. Pls report any issue to us.
Excel Export only working with Internet Explorer and Active X
Check the following:
use Microsoft Internet Explorer (IE)
activate ActiveX support in IE settings
use a supporter renderer/aggregator (e.g. table/sum)
Contact us at support@mirrorlake.eu for any issue and report browser and MS Office Version.
Chart is empty or "syntax error" shown
In complex configuration scenrios it could happen, that teh chart can not be loaded anymore.
Rootcause
Rootcase is a limitation in the length of the gadget configurtion stored in Jira. IF the user applies "too many and too large" configuration settings it might lead to URL messages like "Can't rewrite URL because it is too large". Also a completely empty gadget could be the result.
Fix / Avoidance Improvements could bring server side adjustments as described here:
We are working on a way to prevent too long configuration settings. From end user perspecitve you can not fix this issue, but you can create a new gadget and follow our recommendations for performance improvements (see below).
How to improve performance of dashboards
Avoid loading data of unused fields
Only select fields for your gadget configuration, that you really need for building tables or charts. If you have fields in the "unused field container" you can remove the field from the chart configuration page.
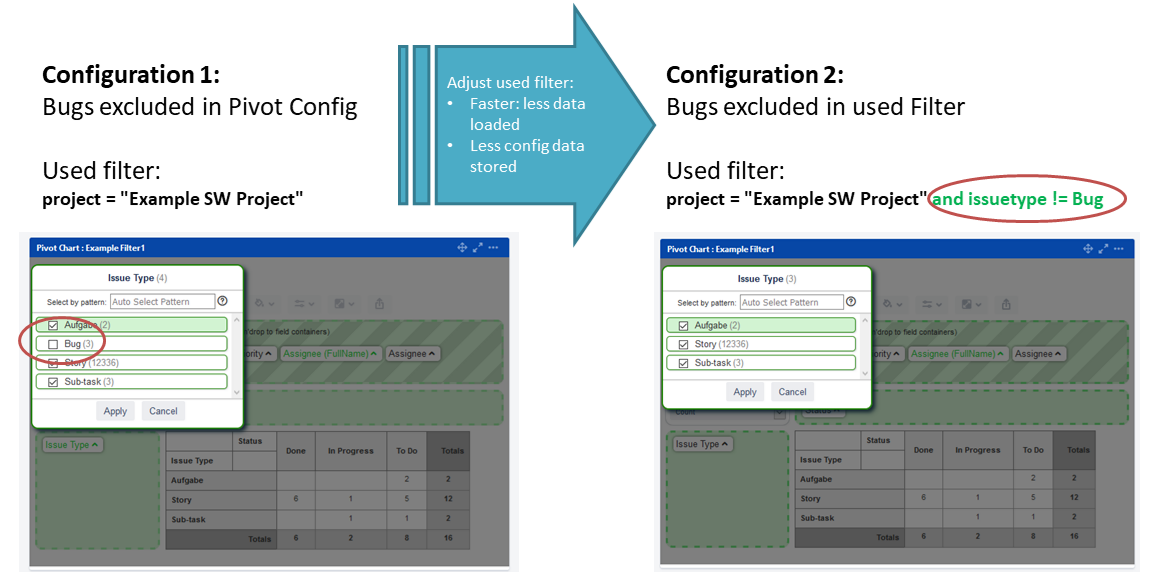
Do not load data excluded in chart configuration
The field containers allow to deselect usage of certain field values. Massive use of this options carries two problems:
The field data initially loaded by the chart is not reduced by this option. From performance perspective it is recommended to reduce loaded data adjusting the used filter and exclude issues showing these values.
There is a limitation of configuration length that can be stored by the chart. If too many values especially of a larger length are deselcted in the chart, the configuration storage space could be exceeded and the chart could have problems to be shown with the next browser refresh. This problem is know and being fixed soon. As a workaround pls adjust the JQL and reduce usage of field value selection in the pivot GUI as shown below: